Margin of error: how reliable can the results of a survey be?
.png)

Introduction
Although the margin of error a concept frequently used in market research reports, this term has only recently gained popularity. However, it is an essential element to know, because the margin of error plays a key role in assessing the reliability of an investigation and the accuracy of its results. But what exactly does it consist of? How to integrate it effectively into your marketing surveys? And to what extent can the result of a survey be reliable thanks to this indicative? 🔎🤔
Margin of error: Definition and calculation
A. Definition: What is the margin of error?
In the world of consumer research, the margin of error determines to what extent the results of a questionnaire are likely to represent the opinion of an entire population. In a more factual way, it indicates How much the results of a survey could vary if the survey were done again 🤓.
As its name suggests, the margin of error delineates a range of values above and below the results of a questionnaire. For example, if a survey gets a 60% rate of”Yes” with a margin of error of 5%, this means that the general opinion varies between 55% and 65% for the answer”Yes”.
La margin of error is a valuable tool for evaluating the level of reliability of any type of survey. But be careful ⚠, this is not a measure of the absolute precision of the estimate, but ratheran assessment of statistical uncertainty associate. So, a margin of error Rather low means that you can be more confident in the accuracy of your survey results, while a margin of error Higher implies an increased risk that your results will differ from the opinion of the total population. In other words, the greater the margin of error, the less the results of the questionnaire come closer to reality and are considered reliable 👎.
B. How do you calculate the margin of error?
Now that we've laid the foundations for the definition, let's move on to implementing it: How do you calculate the margin of error for a survey? 🤔 Nothing could be simpler, just use the following formula:
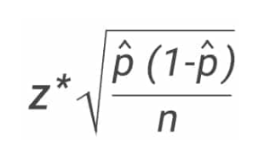
“Nothing could be easier, you say?” Absolutely 😉! While this formula may seem complicated at first reading, don't worry, you just need to understand the meaning of each element:
The “Z” value Refers to trust level chosen beforehand, i.e. the certainty that your sample reflects the opinion of the entire population. A confidence level of 99% means that if you complete the same questionnaire several times with a similar sample, and calculate the margin of error each time, approximately 99% of these margins of error would include the true value of the population. Be careful, this does not guarantee that the true value is 99% within the margin of error, but rather that there is a high probability that your results will fall within this range of values!
The most commonly adopted level of trust by study professionals is to 95%. In a standard normal distribution, 95% of the data is within the range of ±1.96 standard deviations from the mean. So if you have a normal distribution and you want to estimate a 95% confidence level around the mean, you can use 1.96 as the Z value.
🧠 The “n” value: Corresponds to the sample size, that is, the number of people interviewed. Remember that the larger your sample, the less significant and therefore reliable your margin of error will be.
🔎 Finally, the variable “p”: represents The representative proportion of the sample. This corresponds to the number of individuals in the sample who have a characteristic that interests you in the context of your study. It's always A decimal number, equivalent to a percentage expressed in hundredths.
For example, if you are doing a questionnaire on consumer preference for different brands of soft drinks, the variable “p” would be the proportion of participants who prefer a specific brand, such as Coca-Cola, compared to the entire sample surveyed: if 45% of participants prefer Coca-Cola, “p” would equal 0.45 😉.
It's still a bit unclear 😓? Let's explore a practical case together: a company that offers home meal delivery services wants to measure customer satisfaction by conducting a consumer study. Given the large number of customers she has, she opts for a representative sample composed of 400 customers. Analyzing the responses obtained, the company notes that 85% of customers surveyed say they are satisfied of its services 👍, which is equivalent to 0.85 in decimal notation. In addition, she wants to establish a confidence level of 95%, corresponding to a Z score of 1.96. We then calculate the margin of error of this investigation using the formula previously stated: 1.96 * √ ((0.85 * 0.15)/400), which is equivalent to a margin of error of approximately 0.055, or 5.5% 🤓.
This margin of error indicates that the results of the questionnaire may vary up to 5.5% around the observed value, due to random sampling. The company can therefore reasonably say that the real share of its satisfied customers is somewhere between 79.5% and 90.5% (i.e. 85% ± 5.5%) with a confidence level of 95% 😌.
C. Factors affecting the size of the margin of error
While there are various types of survey errors that can potentially affect your results, the size of the margin of error is generally influenced by several factors such as:
- 👀 Sample selection: La margin of error is applicable when conducting a study by interviewing a random sample, which was selected at random from a target population. It is therefore not relevant when the sample was chosen in a non-random manner, such as using a consumer panel with specific and predefined characteristics.
- 🙌 The importance of the sample: The more participants you interview, the more the margin of error is reduced. To improve the reliability of a study, it is therefore necessary to increase the size of the sample interviewed.
- ✌️ The level of trust chosen: La margin of error can also be linked to the level of confidence you place in your results, since it is the amount of sampling errors you are prepared to tolerate according to sample size.
- 🤯 The variability of the responses obtained: Coverage errors may occur, for example, when the survey base does not accurately reflect the target population. It is also possible that some individuals requested as part of a questionnaire do not answer it 😓. Therefore, the sample size only includes respondents who have completed the questionnaire, which can lead to potential variability in the data collected.
Finally, other sources of error, such as question bias, non-response, inaccuracies in answers, or calculation errors, may also be factors to consider.
Margin of error and sample size
A. How does sample size affect the margin of error?
In a marketing survey, sample size is intrinsically linked to margin of error. The art of polling is a delicate balancing act ⚖, which involves using a small group of people (questionnaire respondents) to represent a much larger set (your target market or the total population).
Marketing studies generally involve a relatively large sample size. So unless you have a very small sample size, you are unlikely to encounter significant problems 😉. But if this were the case, it might be necessary to increase the sample size, in order to obtain a lower margin of error and therefore a more accurate estimate.
For example, let's say you want Achieve a reputation study 😎 to assess the quantity of people in a given population who recognize your brand compared to your competitors. You want to examine how the margin of error evolves according to the size of your sample. We will use a confidence level of 95% (corresponding to a Z score of 1.96) and a representative proportion (p) of 50%.
- 1. For a starting sample of 400 participants, you can calculate The margin of error as follows: Margin of error #1 = 1.96 * √ ((0.50 * 0.50)/400). The result is approximately 9.8%.
- 2164 Now, if you decide to increase the sample size to 1600 people, you can calculate the new margin of error as follows: Margin of error #2 = 1.96 * √ ((0.50 * 0.50)/1600), which is equivalent to one margin of error Of approximately 4.9%.
As you can see, by increasing the sample from 400 to 1600 participants, your margin of error is decreasing by half 😲. This clearly demonstrates the crucial importance of the number of respondents in the accuracy of the results of a questionnaire.
B. Our tips for determining the appropriate sample size
You will have understood it, Determining the right sample size is critical to ensuring the reliability of your surveys and get statistically solid results. But how do you choose the ideal sample size 🤔? To do this, you need to consider a variety of factors related to your research and gain an understanding of the underlying statistical principles:
- ✌️ Define your level of trust in advance: The standard confidence level is 95%, but you can choose a higher level (for example, 99%) or lower (90%) depending on your needs. These are the most frequently used levels of trust.
- 👀 Estimate the tolerable margin of error: Determine the maximum margin of error you can accept for your results.
- 🔎 Choose a representative proportion (p): In general, using 50% is a good practice unless you have accurate information about the expected proportion. If possible, make a pre-test study on a small sample to assess the variability of responses. This can help you estimate the “p” proportion more accurately.
Depending on Desired level of trust And of the acceptable margin of error, you will be able to determine the number of respondents needed for your survey 😎. Once you have established the number of people to interview, you are ready to start writing your questionnaire and define details such as the acceptable response time and the most effective method to target your participants 😏.
Why are Madeinvote polls reliable?
A. Our vigilance against bias factors
The expertise of Discurv In terms of margin of error and surveys is the result of our solid experience in producing reliable and accurate questionnaires. What if today Our consumer studies On the social networks are renowned for their reliability, this is explained by several reasons 😌.
First of all, our team of experts constantly makes sure to identify and control the bias factors that may affect the results of our questionnaires, such as:
- 👽 Selection bias: We ensure that our sample of respondents is representative of the target population you want to study. Thanks to our targeting methodology on social networks, we also minimize the risk of bias in our results by ensuring a random and balanced selection of respondents.
- 😴 Non-response bias: We are taking steps to minimize the number of non-responses in our surveys. Our aim is to encourage participation and to obtain as complete a sample as possible.
- 🤔 Question formulation bias: How questions are asked in a questionnaire can have a significant impact on the feedback received. Chez Discurv, we strive to design questions that are neutral, balanced and free of any suggestive language, in order to obtain objective and authentic answers from our participants.
B. Transparency in our surveys
Transparency 👀 is a fundamental value at Discurv: since 2016, our team has been committed to providing comprehensive information on methodology used, data collection protocols, participant selection criteria, and confidentiality guarantees. This transparency allows respondents to make an informed choice when answering the questionnaires and allows our customers to fully understand the results 👍.
Discurv is also committed to using advanced statistical methods to ensure the accuracy of the results and to providing reduced margins of error 😎. This rigorous approach allows our client companies to make informed decisions based on accurate and high-quality data. We encourage you to explore our customer case studies to find out more 😉.
C. Ensure the accuracy of your survey results with Discurv!
Determining the accuracy of your study data has never been easier with Discurv ! 😎 With 7 years of experience, our research institute has established itself as the reference in terms of Sampling social.
Our approach is based on mathematical reliability, ensuring that each questionnaire is designed and distributed to minimize inaccuracies. We use advanced statistical methods to accurately determine margins of error, allowing our customers to make informed decisions with confidence.
In other words, by choosing Discurv, you benefit from unparalleled statistical expertise! ✨
Conclusion
In summary, the margin of error is an essential element in the design of a well-balanced survey. It is of paramount importance to assess the effectiveness of your investigation. A weak margin of error is a sign of greater confidence in the results of your study 😌, while a margin of error High indicates a greater disparity between the results of the questionnaire and the opinions of the general population. After calculating your margin of error, along with associated parameters such as sample size and confidence level, you can start your study on a solid and reliable basis 😎.
For reliable and accurate insights, trust Discurv ! Contact us today to find out more about how we can meet your study needs.

.png)